
Finding an automated trading strategy that does well in both ranging and trending markets seems to be elusive. Most systems do well in one or the other, but combining trading systems into a single strategy can give you the best of both worlds. Here’s one I’ve been working on that looks promising.
I’ve been toying with a few python based bots that don’t use a DCA strategy and therefore negate the requirement for using 3Commas as a means to control the exchange buy and sells. I’ve already had success in buying and selling, setting take profits and stop losses etc through FTX using the cctx python library.
The next step is to find a decent strategy that works with most coins in any market. I recently came across an article on a mean reversion strategy from Bryan Chen – Algorithmic Trading: Mean Reversion using Python which uses a pretty basic system for buying and selling based on Bollinger Band crosses and RSI levels.
So I decided to create a pretty basic pine script strategy in TradingView to give it a test on some of my favorite coins. The results were ok. Nothing impressive, though the majority were positive. This prompted some deeper dives and to tackle another issue Bryan mentioned in his article:
Another limitation was that it was unable to find trades in a trending market…
Prior to coming across his article I was playing around with a bunch of other trend following strategies, and one that also looked promising used the ADX indicator to determine trend strength and a slow and fast moving average to determine trend direction. So I combined the two strategies into one and ran several tests to get some results.
The Strategy
The strategy uses the following long and short signals:
- Closing price above or below the Bollinger Bands with RSI confirmation. The system goes long when a candle’s closing price is below the lower Bollinger Band and RSI is below 30, and vice versa goes short when the closing price is above the upper Bollinger Band and RSI is above 70.
- ADX value is above 25. Since the ADX indicator is non-directional, I use EMA 20 and EMA 40 indicators to determine trend direction. So a long buy signal is sent when EMA 20 is higher than EMA 40 and ADX is above 25. A short signal is sent when EMA 40 is higher than EMA 20 and ADX is above 25.
- Trend Validation. I added an optional daily EMA20/40 cross trend validation to control all longs and shorts. If the daily EMA signal indicated an uptrend, no shorts would be allowed, and vice versa if a downtrend was indicated, no longs would be allowed.
Note the signals will be either – or. For example, a long position from the ADX being above 25 will not be sent if a long position is already open from a BB cross. Same for shorts. The strategy doesn’t allow for both long and short signals/positions at the same time.
The following signals are used to close positions:
- Closing price above or below the Bollinger Bands with RSI Confirmation. Like the long/short signals from above, positions are closed when the price closes above or below the opposite Bollinger Band while RSI is also below 30 or above 70.
- ADX value crosses below 25. In this case, a value lower than 25 typically signals the end of a trend, so we don’t need to know the direction, and a cross below 25 would close a long or short.
- Stop-Loss. Hitting a predefined stop-loss would also close a long or short.
Note for items 1 and 2 above, the closing signals don’t overlap and the trades are considered independent. For example, if a long position is active due to a close below the lower BB and RSI below 30, a cross below 25 on the ADX will not close the position.
The Settings
- Date coverage: May 1st to September 15th
- Time frame: 4 hour*
- Bollinger Bands: Length – 20, Standard Deviation – 2
- RSI: 14**
- ADX: 14
- Stop Loss: -1.5%
* A random selection of coins indicated this time frame was producing the best results for the dates tested.
** Bryan’s strategy was based on an RSI value of 6, but in my testing a 14 period RSI value yielded significantly better results across the board.
The Test
I setup my Pine Script strategy on TradingView in such a way that I could test a few different versions. Specifically:
- Longs and Shorts, with Trend Validation
- Longs and Shorts, with no Trend Validation
- Longs only with Trend Validation
- Longs only with no Trend Validation
- Shorts only with Trend Validation
- Shorts only with no Trend Validation
Here’s an example of a long trigger and close on the Bollinger Band + RSI portion of the strategy:

And here’s an example of a couple of long triggers and closes based on the ADX strategy:
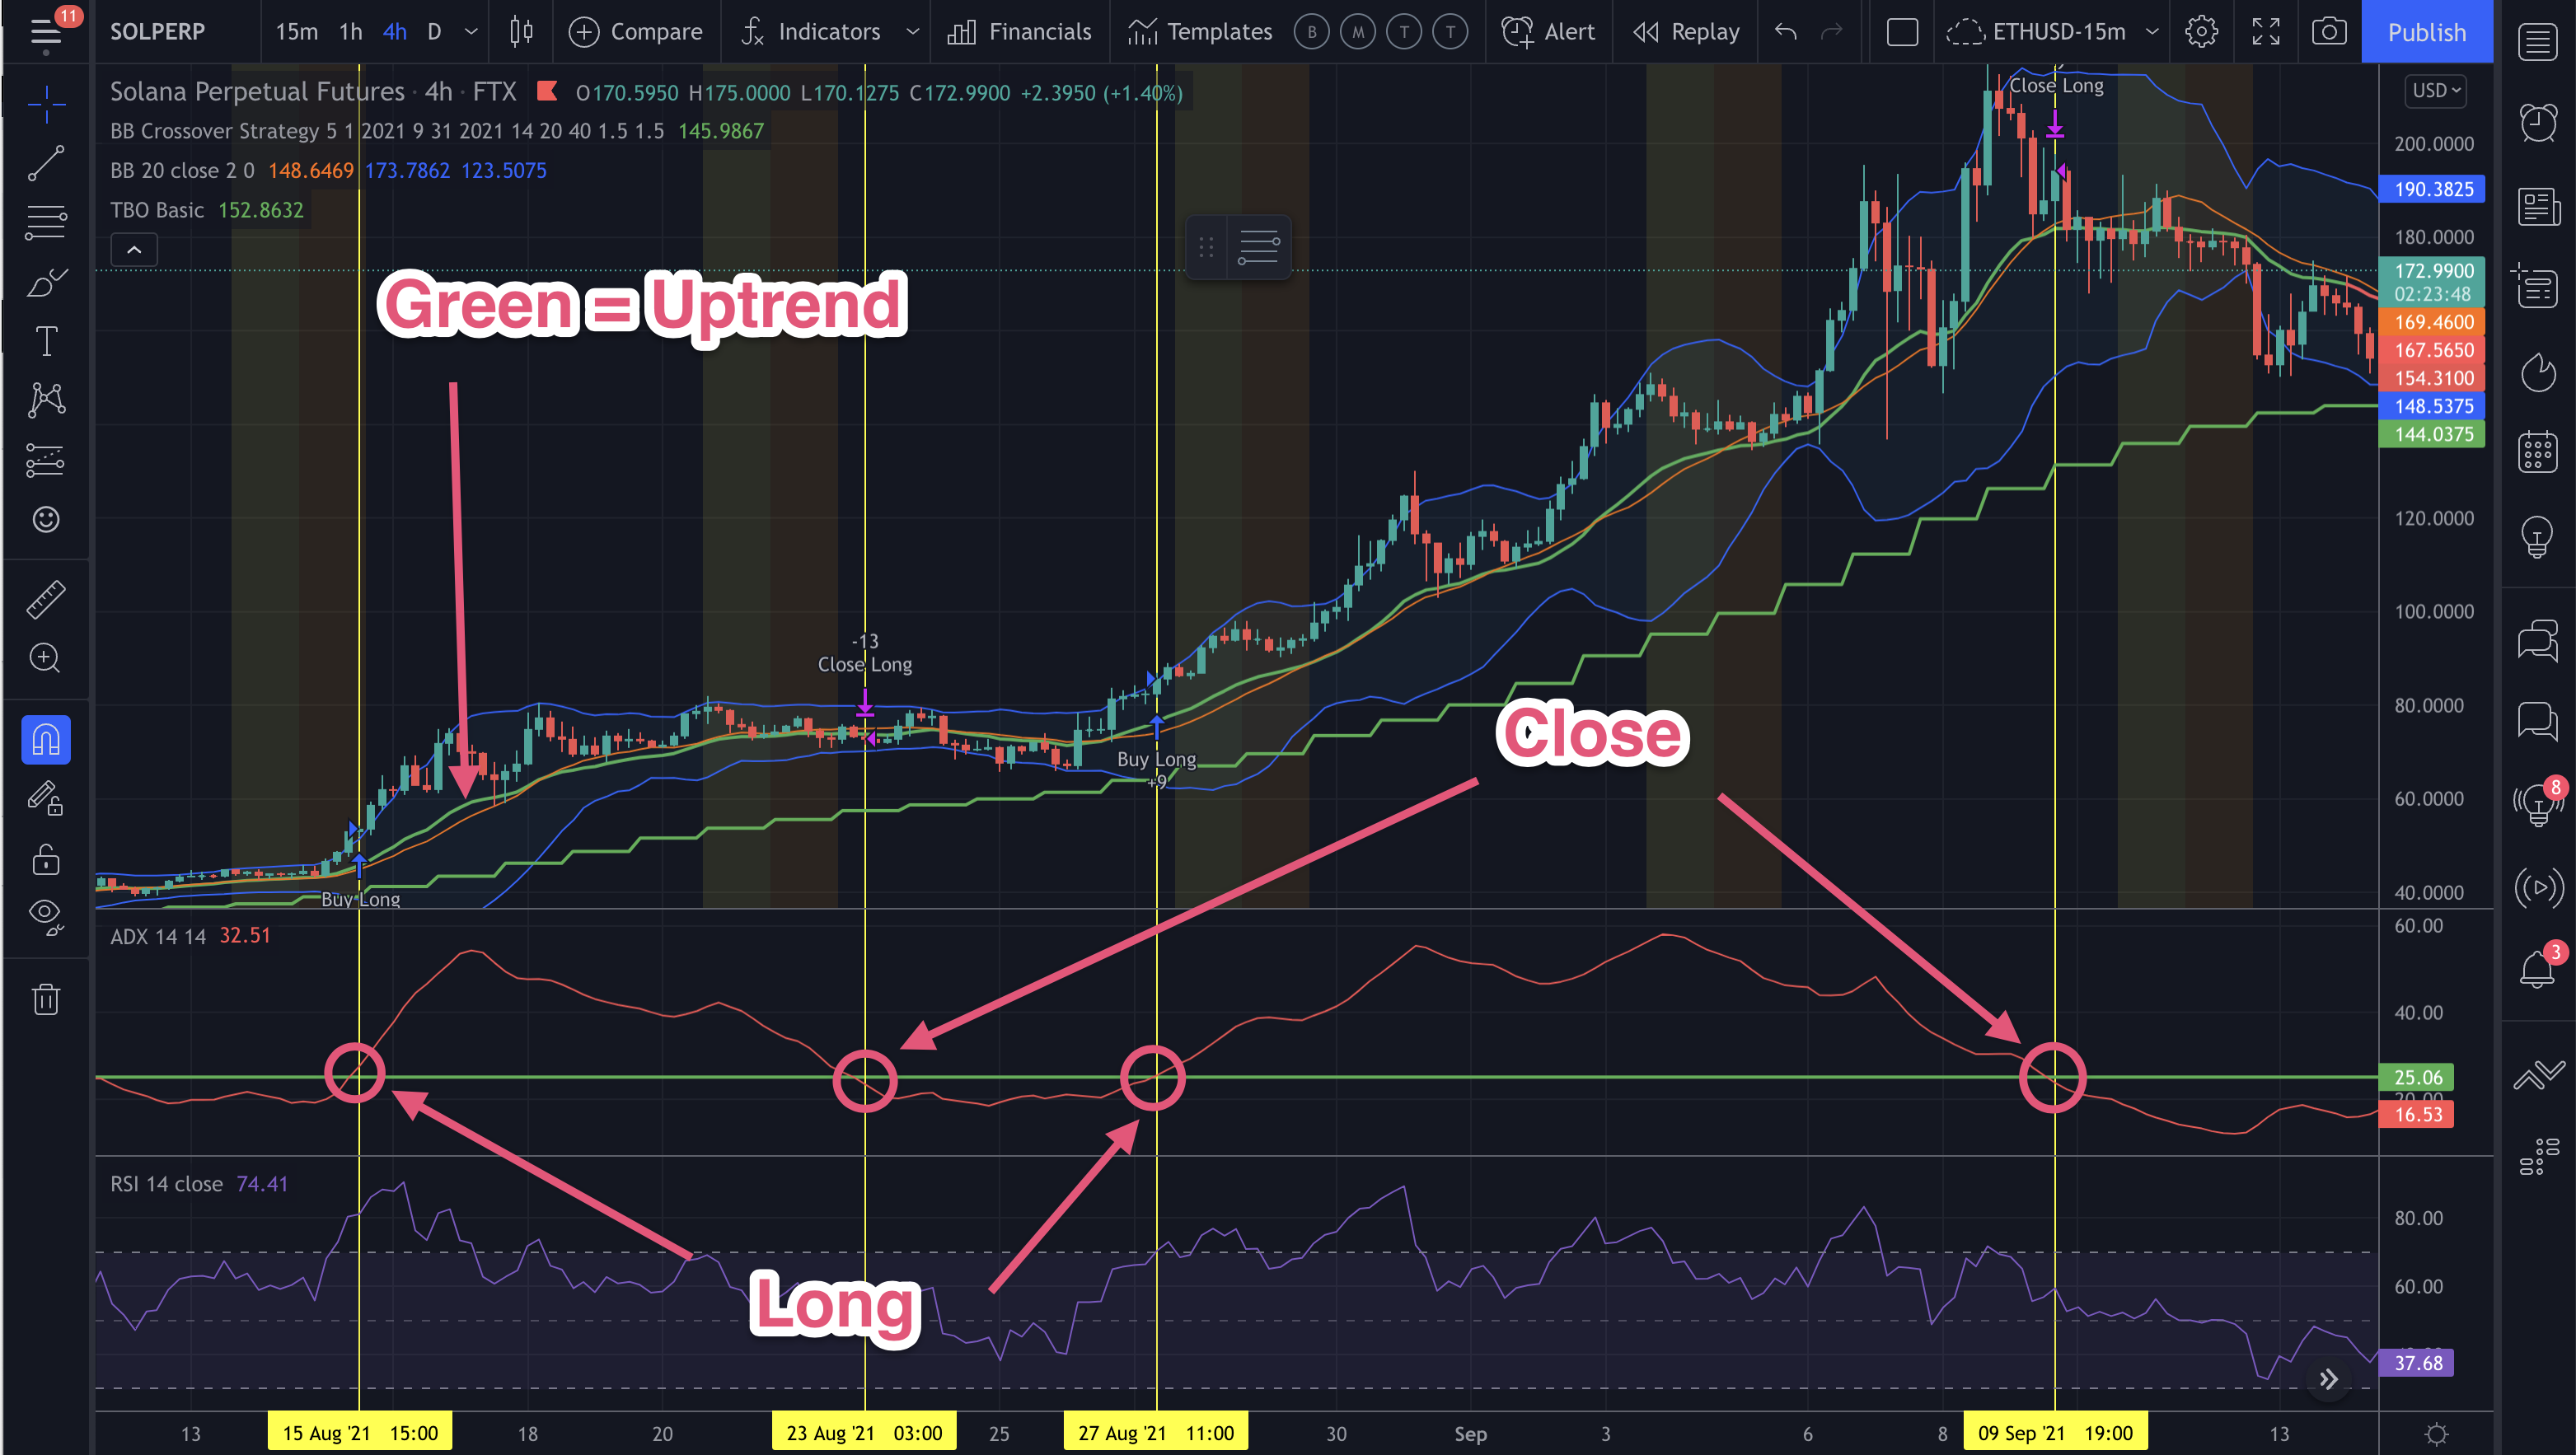
Note I’ve included a custom trend line indicator in the chart to show the trend is up. The line is green, meaning EMA20 is above the EMA40. The strategy uses the same logic to determine if the ADX is indicating an up or down trend.
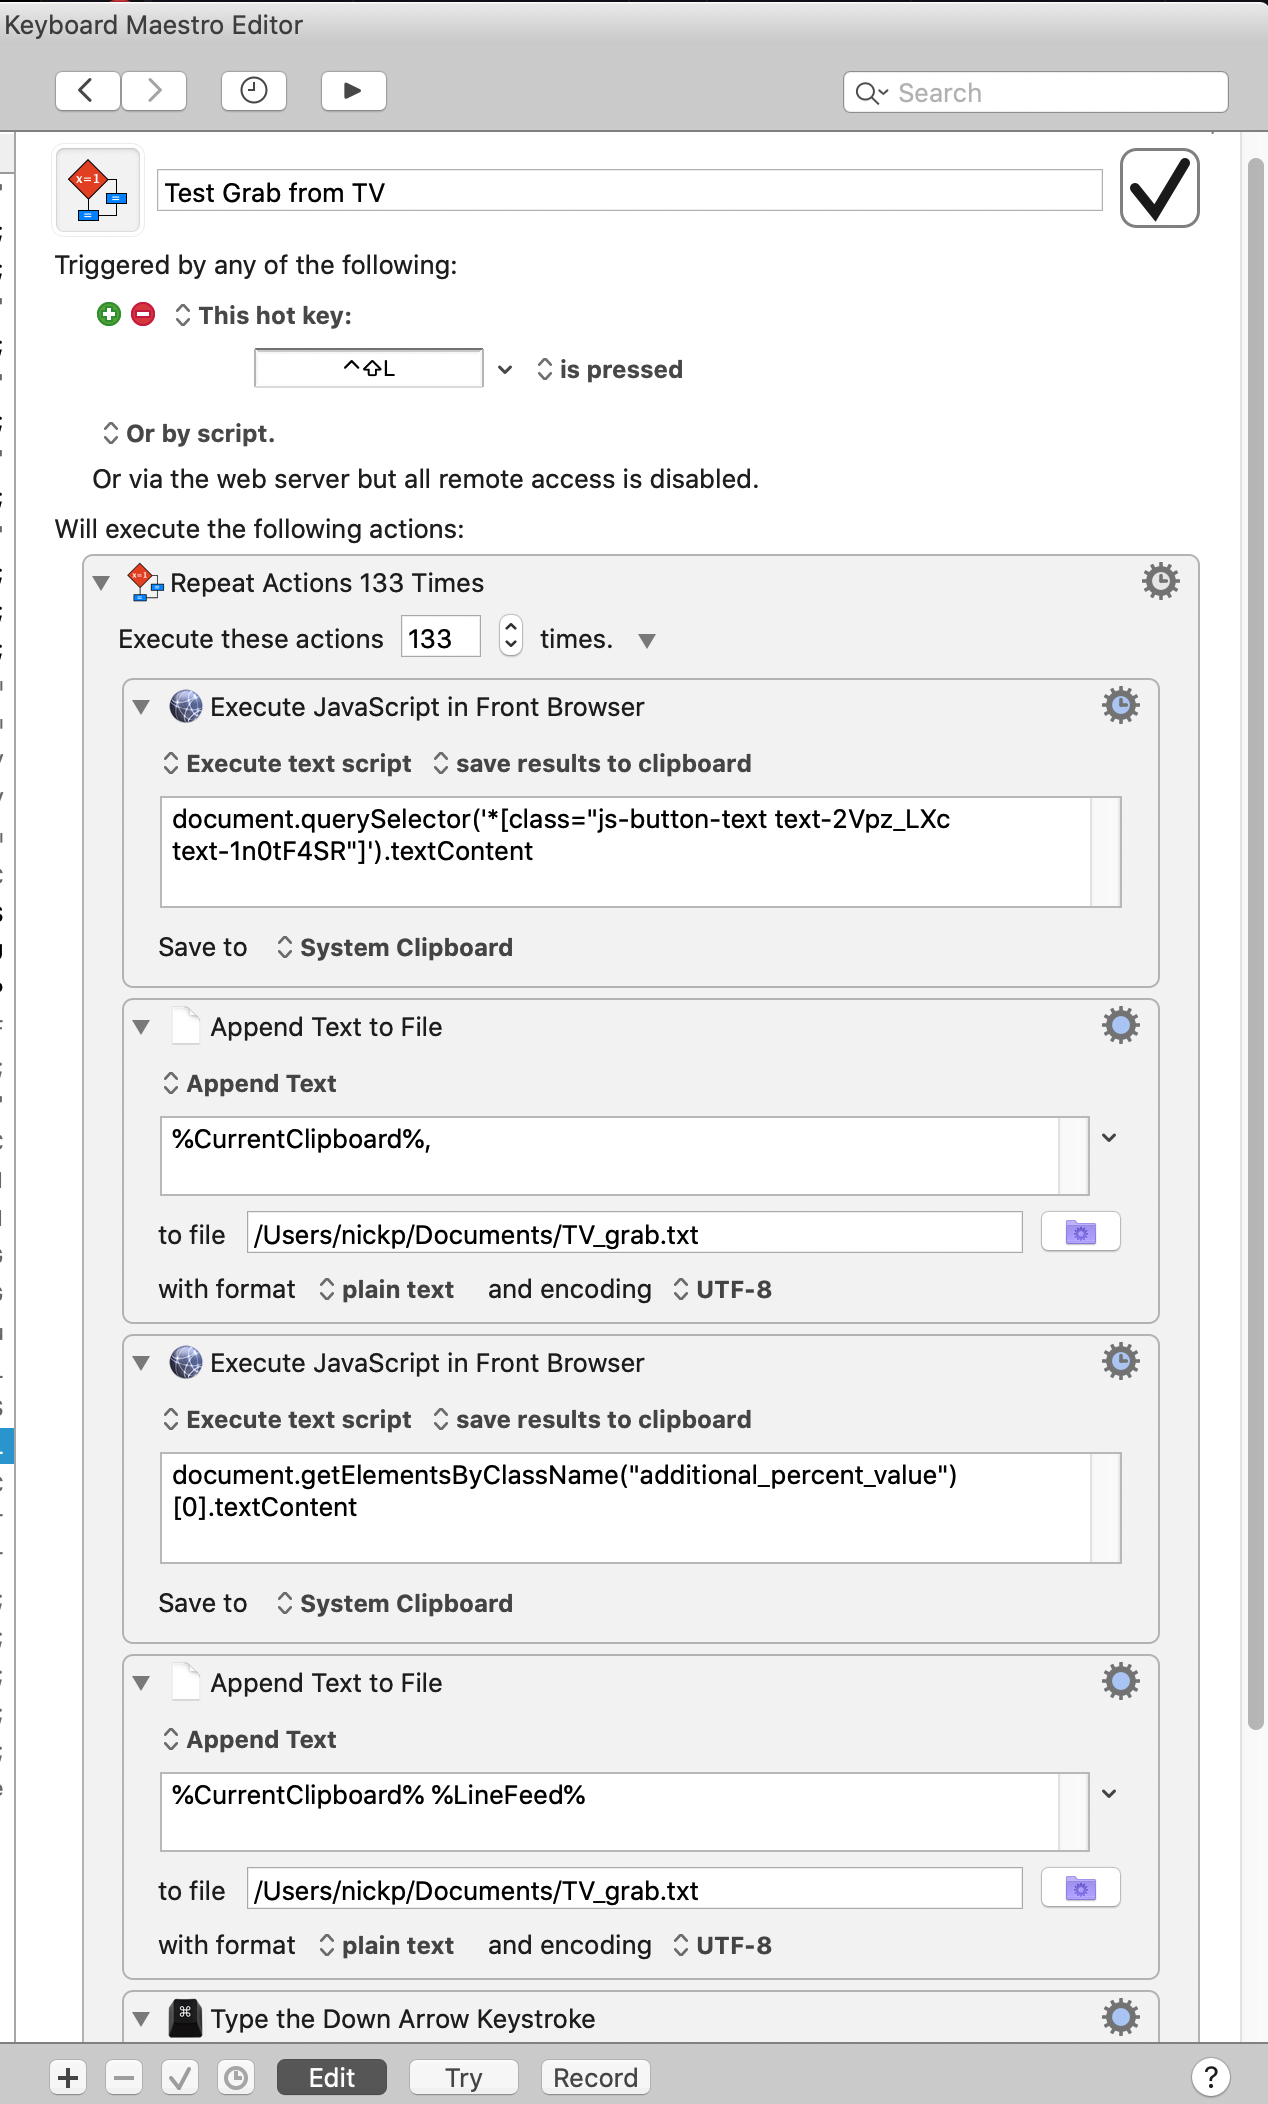
The next challenge was to test each of the above versions for all of the FTX perps, about 130 of them, and record the net profit or loss for each one. Since TradingView only allows you to test on one chart at a time, this required the creation of a macro to grab the perp name, then the net profit, and write the result to text file. Then repeat another 130 or so times. I won’t go into much detail on that, but in a nutshell I used a program called Keyboard Maestro to capture the perp name and net profit by using some JavaScript to get the text content within the specific css class or selector, write it to a text file, then simulate a down arrow key to move to the next perp on my watchlist, and then repeat.
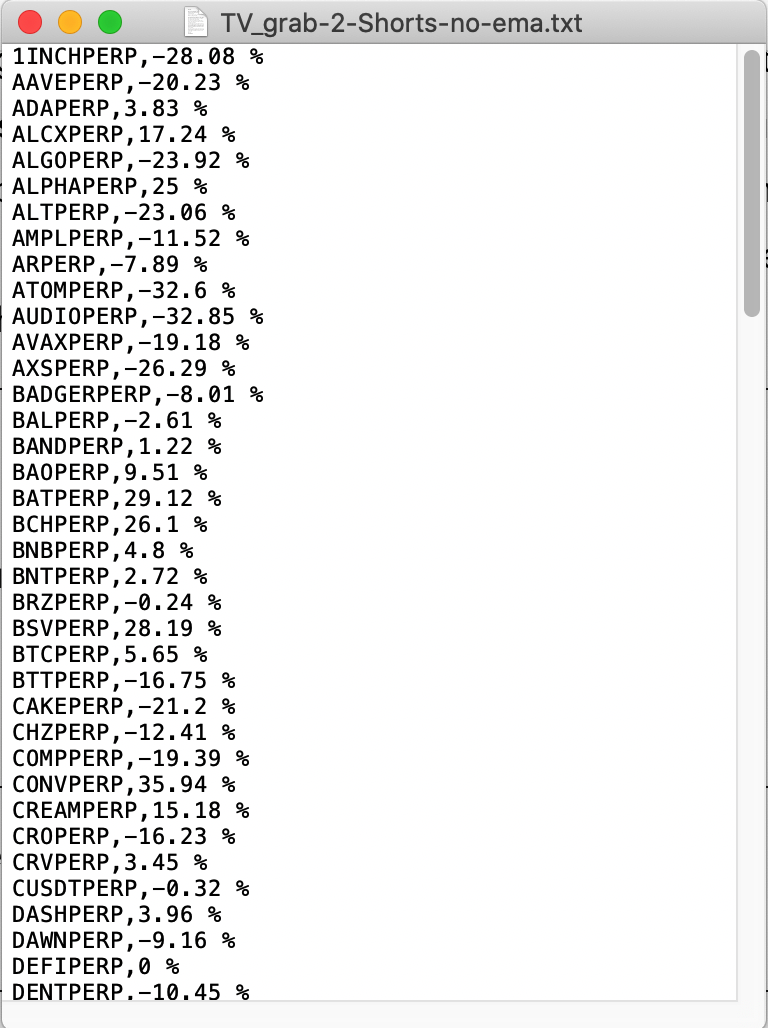
I ended up with a text file with a listing of all the perps with their corresponding net profits which I could import into a spreadsheet.
I then re-ran the same Keyboard Maestro macro again, this time with a different version of the back test in order to collect the results for that particular version. I ended up with six different text files with the test results.
The Results
After importing the results I ran some simple calculations to show the comparison between each strategy variation, and here’s what a portion of that table looked like:
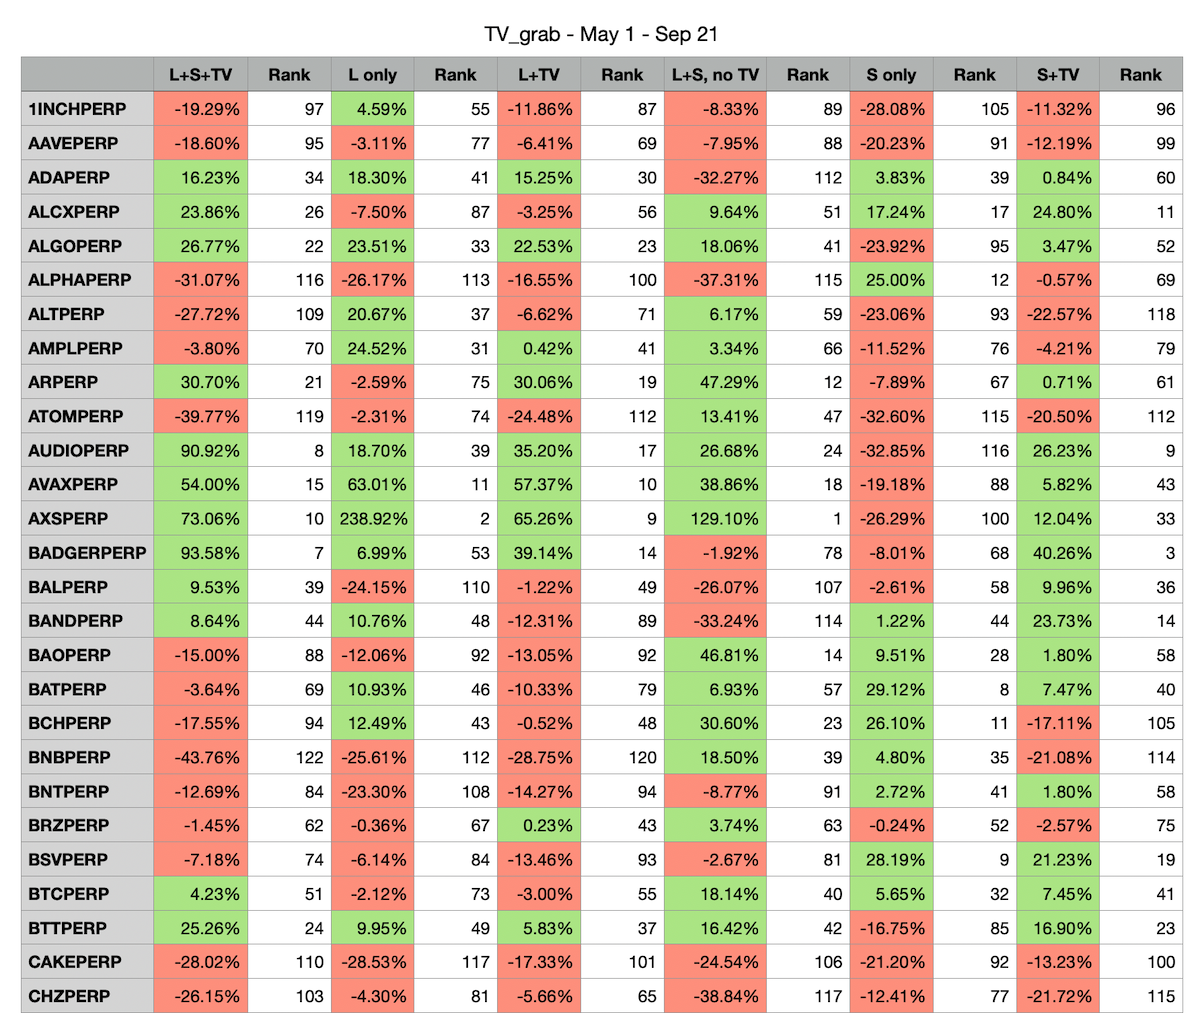
The titles in the header row are shortened, so L = Long, S = Short, and TV = Trend Validation. So for example, L+TV is the backtest strategy trading only longs and using the daily EMA20/40 Trend Validation to limit longs to only trigger in an uptrend.
I made some simple calculations at the bottom of the table to try and compare which one works best:
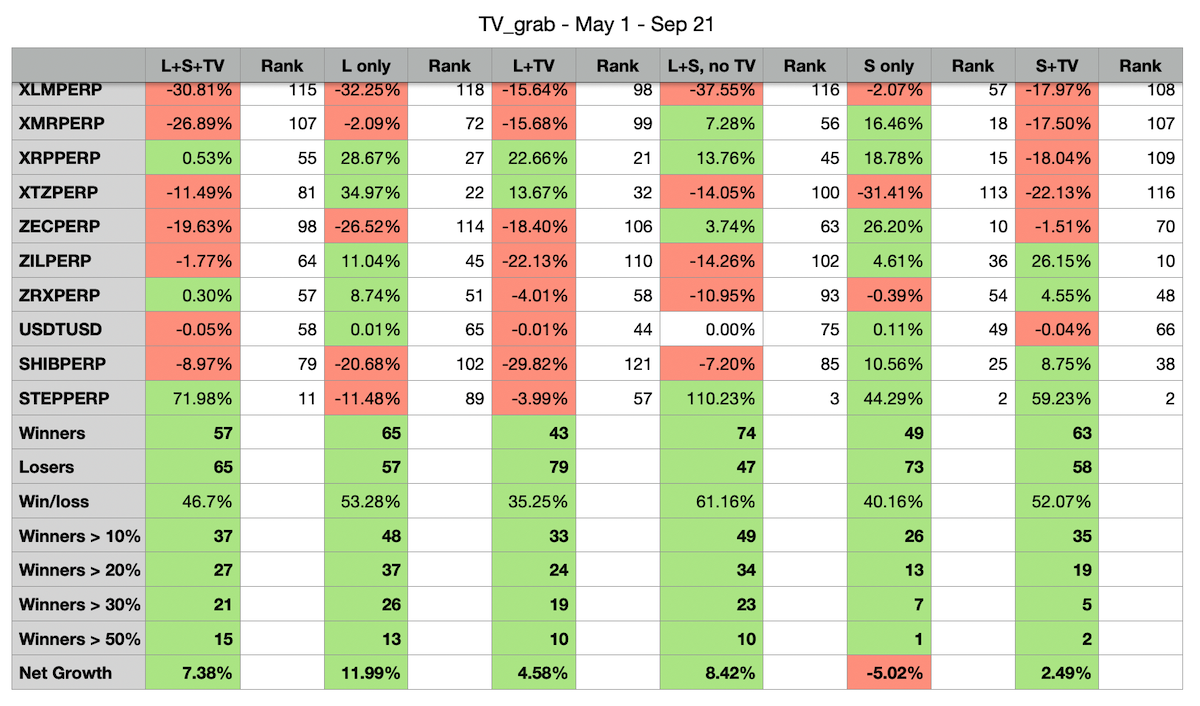
Now, there’s probably a hundred different ways to capture and calculate the results, and likely capturing more fields from the strategy results for each perp could also give more details, such things as total trades and win/loss ratio for each perp, but the intent here was to do a quick and dirty run to see a) how the strategy worked, and b) which variation, if any, stood out as a better option.
Based on the results, it looks like the L+S (Long and Shorts) with no Trend Validation active yielded the highest win ratio (61.16%) across all the perps tested for that time frame.
Now, the Net Growth values shows that longs only would be a better choice at 11.99%, but this is really just a simple average of all the net profits from all the perps. I’m not convinced (yet) this number has any meaning since the calculation assumes an equal distribution of each token (which won’t happen in real life), and the time period had a small bull run at the end of the period for many of the perps, hence favoring some of the winners. If it was a bear market during the test, then maybe the shorts only test would have prevailed.
For now, based on the initial tests, it looks like the strategy works for most pairs tested.
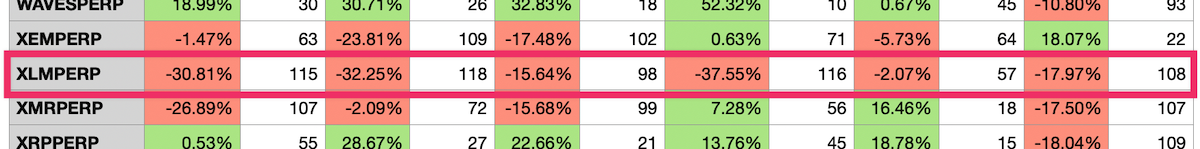
It’s interesting to note that some pairs work well on the strategy, while others don’t, regardless of the variation – at least for the time period tested. For example, take a look at XLM, regardless of the variation, the strategy just failed to produce any positive results:
Then there were others that worked well on the strategy, like KIN for example:
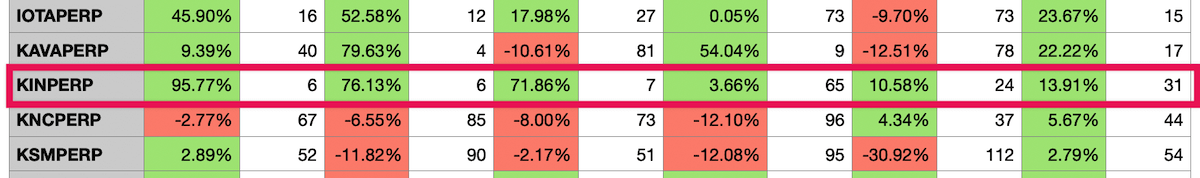
Perhaps this identifies a few perps that should be blacklisted, and some that should be whitelisted, but definitely some more testing is needed to confirm if that particular trend continues or not.
What’s Next
Code it!
The next step requires putting this into a python script to execute live trades based on the same strategy. I will likely include all the same variations into the code since results may vary over time, and have these as configurable parameters in a config file. This particular script will also not use 3Commas, and trade directly through FTX since it has specific buy and sell points based on the indicators, so DCA bots are not required here. Instead we will use stop losses to kill any losing deals.
More Testing
We need to remember the markets are random, so the results will change over time and we’ll need to adjust the script parameters to suit. This means the testing will need to be continued every month or quarter to see if the same variations, or even the whole strategy, remains viable and adjust as needed.
Opportunities
A few thoughts on additional tweaks to include in the final script that may help the overall performance of the strategy:
- Allow the strategy to take two long positions on the same coin/perp. The original strategy doesn’t allow this, as mentioned above. Allowing a doubling of the positions, but still keeping the close signals separate, may help squeeze out a few extra points of profit.
- Blacklist any coins that show they consistently don’t do well with the strategy, as explained above in the test results – keeping in mind this can change over time, and hence the need to continuously test and adjust.
- Similar to the above but for consistently well performing coins, rank the coins by how well they perform on the strategy and either open larger positions for these coins, or use a specific coin list ordered by highest performers first for the script to use for fetching data. This way bias is given to the top performers (if you have limited funds or want to restrict to a max number of open positions).
Stay tuned!
Stay up to date on all the posts and how-to’s, Subscribe!
